[ Credit Risk ]
Early Warning Signals in Banking Data: What Fires First, and What Fires Too Late
Standard EWS lists were built for large corporate exposures and lag by a quarter. The signals visible in a borrower's bank account, the order they appear in, and why a single indicator is noise while two together are not.
8 min read · 31 August 2026
Contents
Every lender knows that by the time an account reaches 30 days past due, the trouble started months earlier. The question is where it was visible in the meantime.
Most published EWS indicator lists answer this badly, because they were designed for a different kind of borrower. They lean on stock statements, auditor changes, delayed financials, site visits, consortium disclosures and ratings movements — all of which are quarterly at best, all of which depend on the borrower or a third party producing something, and none of which exist for a ₹15 lakh MSME loan.
For most of an Indian lender's book, the account is the only continuous, non-self-reported source of information about the borrower there is. This post is about reading it: which signals appear, what thresholds mean anything, and — the part almost nobody writes down — the order they arrive in.
The regulatory position, briefly
EWS is not optional. The RBI's revised Master Directions on Fraud Risk Management require banks and NBFCs to operate an early warning signal framework integrated with core banking systems, with accounts showing one or more indicators classified as Red Flagged Accounts for deeper investigation.
The framework attaches timelines. Boards are expected to prescribe a turnaround time for examining EWS alerts, preferably no more than 30 days from generation; red flagged status must be reported through CRILC within 7 days of an account meeting the threshold and criteria; and a decision on fraud classification is expected within 180 days of red flagging. The CRILC reporting threshold for red flagged accounts currently stands at ₹3 crore of exposure. The NHB has extended comparable EWS obligations to housing finance companies above ₹1,000 crore in asset size.
Two things follow. First, an alert that nobody examines within the window is a compliance failure regardless of how good the detection is. Second, and more usefully: the regulatory framing is fraud-oriented, while the commercially valuable use of the same data is stress detection. The signals overlap heavily. The response differs entirely.
Also worth stating because it is frequently ignored: courts have held that a borrower must receive notice and a hearing before an account is classified as fraudulent. A system output is an input to that process, never a substitute for it.
Why banking data is the only viable monitoring source for most of the book
Three properties, and no other data source has all three.
Frequency. Financials are annual. Stock statements are monthly at best and often late. GST filings are monthly but describe invoicing, not money. Bureau data reports with a lag of weeks. Banking is continuous.
Independence. Financials, stock statements and declared projections are produced by the borrower. Banking is produced by the bank. A borrower under stress can delay a stock statement. They cannot delay their own end-of-day balance.
Availability at small ticket. The entire apparatus of consortium meetings, stock audits and rating reviews exists only above a certain exposure. Below it — which is most accounts by number — there is nothing but the account.
The signals, grouped by what they measure
Thresholds below are deliberately relative. An absolute figure is close to meaningless: 85% utilisation is normal for one borrower and alarming for another. Every threshold should be set against that borrower's own trailing baseline, typically a six-month median.
Liquidity depletion
- Average end-of-day balance trending down across three consecutive months against the trailing median.
- Zero-balance days increasing. The count of days in a month where the account touched zero. Movement from two days to eight is a stronger signal than any single month's average.
- Lowest monthly balance falling faster than average balance. The floor dropping while the mean holds means the borrower is running closer to empty between inflows, even though the headline looks stable.
Facility stress
- CC or OD utilisation creeping toward the sanctioned limit and staying there. Peak utilisation matters less than the number of days above 90%.
- Overdrawn days appearing where there were none.
- Interest being serviced from the facility itself rather than from operating inflows — the classic sign that the limit is funding its own cost.
Payment conduct
- EMI delay days lengthening before any miss occurs. A payment moving from the 3rd to the 9th to the 14th across three months is a signal that fires well before a bounce does, and almost nobody tracks it.
- Bounce frequency rising.
- Bounce reason codes shifting from technical to non-technical. This is the more informative movement. A shift from mandate-administration failures to insufficient-balance failures is a change in the borrower's condition; a shift to stopped payments or cancelled mandates is a change in their intent. Our NACH return code reference sets out which codes fall where.
Throughput decline
- Monthly credit value falling against the trailing median, adjusted for the borrower's known seasonality.
- Transaction count falling. Value can be held up by one large credit; count cannot. A declining count with stable value usually means a real business shrinking behind a single lumpy inflow.
- Nil-credit windows. A gap in receipts across a period that should be continuous trading — for example, no credits between the 20th of one month and the 5th of the next — indicates an account being maintained rather than operated.
Counterparty change
- Loss of a top counterparty. A buyer contributing 20% of receipts disappearing is a revenue event that will not appear in any financial statement for months.
- Concentration rising. Fewer counterparties carrying more of the total means less resilience, even at constant turnover.
- New large counterparties with no history. Not inherently adverse, but requires explanation.
Related-party dependence
- Self-transfer and group inflows rising as a share of total credits. The promoter is funding operations. This is one of the strongest pre-default signals in SME lending and it is invisible unless related-party flows are isolated and netted rather than counted as revenue. The identification and netting method is set out in our post on related-party and circular flows.
New obligations
- New recurring EMI debits appearing that do not correspond to anything on the bureau. The borrower has taken credit elsewhere, and the bureau has not caught up — or the lender does not report.
- Fresh disbursals arriving shortly before obligation dates. Borrowing to service borrowing.
Loss of visibility
- The account going quiet while the business continues. Banking has moved elsewhere. Dormant and inoperative return codes on a live borrower say this explicitly.
- Account Aggregator consent revoked. A deliberate withdrawal of your visibility, discussed further in our post on what AA does and does not solve.
The order these signals arrive in
This is the part that makes the list usable, and it is largely absent from published EWS material.
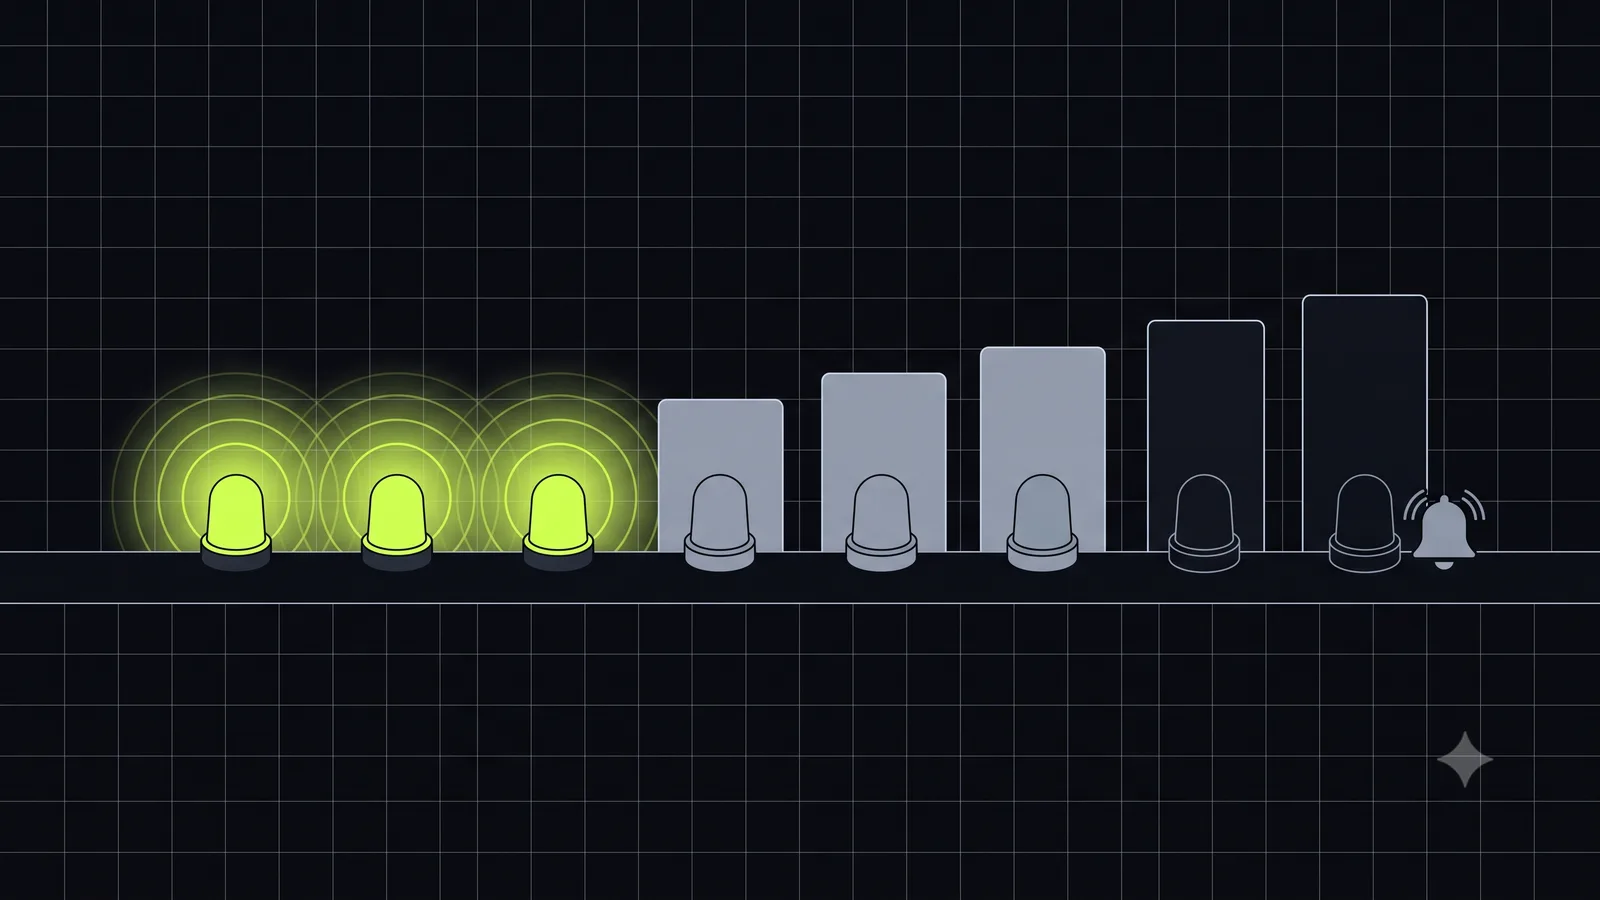
The signals are not simultaneous. In a typical MSME deterioration they arrive in a rough sequence:
- Utilisation rises and balances thin. The borrower absorbs the first shock with the facility. Nothing else has changed. Months 1–2.
- Throughput softens. Credit value or transaction count starts drifting below baseline. Months 2–3.
- Related-party inflows rise. The promoter starts covering gaps. Months 3–4.
- EMI timing slips. Payments still land, but later each month. Months 4–5.
- Technical bounces appear. First failures, often on the first presentation with success on re-presentation. Month 5.
- Non-technical bounces. Insufficient funds, repeatedly. Month 6.
- DPD registers. Month 6–7.
- Bureau reflects it. Month 7–8.
The exact timing varies. The ordering is fairly stable, and the implication is uncomfortable: an institution monitoring on DPD and bureau data is working from steps 7 and 8 of an eight-step process. Everything before it was observable in the account.
Step 4 deserves particular attention. Delay days lengthening is the last signal before failure becomes visible externally, it is cheap to compute, and it is almost universally discarded because systems record whether an EMI was paid rather than when.
One signal is noise. Two together are not.
Any individual indicator has an innocent explanation, which is why alert fatigue destroys most EWS implementations. Utilisation rising means growth as often as it means stress. A large counterparty disappearing may mean a completed contract.
The credit event is the co-occurrence. Some pairs that mean substantially more together than apart:
| Combination | Reading |
|---|---|
| Utilisation rising + throughput falling | Facility funding a shrinking business |
| Related-party inflows rising + EMI delay lengthening | Promoter covering obligations the business cannot |
| Zero-balance days rising + new EMI debits appearing | New borrowing into an account with no headroom |
| Throughput stable + transaction count falling | Revenue concentrating into fewer, larger, possibly non-trade credits |
| Counterparty loss + utilisation rising | Revenue gap being bridged with credit |
| GST turnover stable + banked credits falling | Receivables not being collected — see our post on turnover variance |
Escalation thresholds should be built on combinations, with single indicators logged rather than alerted. This is also the practical answer to the 30-day examination window: an alert volume built on single indicators cannot be examined within any window, while one built on co-occurrence can.
What this requires underneath
Every signal above depends on categorisation that is actually correct.
Related-party inflows cannot be tracked as a share of credits if both legs of a circular flow were labelled "transfer" and never linked. New obligations cannot be detected if the recurring debit was not identified as an EMI. Throughput cannot be measured if loan disbursals are sitting in the revenue line inflating it — and a disbursal misread as a trade credit will make a deteriorating account look like a growing one, which is the worst possible failure mode for a monitoring system.
We measured how often these specific misclassifications occur across 200,001 transactions. The error rate on exactly these categories is what determines whether an EWS built on banking data produces signal or noise.
The same inputs also drive coverage. A monthly DSCR built from banking data moves later than the signals above, which is precisely why a comfortable ratio on a deteriorating account deserves a second look.
Frequently asked questions
What are early warning signals in banking? Indicators of borrower stress or potential fraud detected before an account becomes delinquent. Under the RBI's Fraud Risk Management framework, banks and NBFCs must operate an EWS system integrated with core banking, with accounts showing indicators classified as Red Flagged Accounts for investigation.
What is a Red Flagged Account? An account displaying one or more EWS indicators suggesting fraudulent activity, requiring deeper investigation. Red flagged accounts above the prescribed exposure threshold must be reported through CRILC within seven days, with a fraud classification decision expected within 180 days.
Which early warning signals appear earliest? Facility utilisation rising and end-of-day balances thinning typically appear first, followed by declining credit throughput and rising related-party inflows. Lengthening EMI delay days precede actual bounces, and bounces precede DPD. Bureau data reflects the situation last.
How is EWS different for MSME borrowers? Conventional indicator lists rely on stock statements, audited financials and site visits, which either do not exist or arrive too late for small-ticket exposures. For MSME monitoring the bank account is generally the only continuous, independently produced data source available.
How many EWS indicators should trigger an alert? Alerting on single indicators produces volumes no team can examine within the expected review window. Logging individual signals and alerting on co-occurrence — utilisation rising alongside throughput falling, for example — keeps alert counts examinable while catching the patterns that actually precede default.
Fiscus tracks conduct, balance, utilisation, counterparty and related-party signals month on month across every account in a borrower's case, from origination through the life of the loan. Book a parallel evaluation on accounts your team is already monitoring.
Written by
Zeus DhanbhooraZeus Dhanbhoora is the CEO of BridgeUp Tech, the company behind Fiscus. He previously co-founded Bacferim Technologies and was an associate at the law firm Bharucha & Partners. He writes the Fiscus credit desk blog on benchmarks, fraud detection and credit underwriting methods.